Senior Data Scientist · Chicago

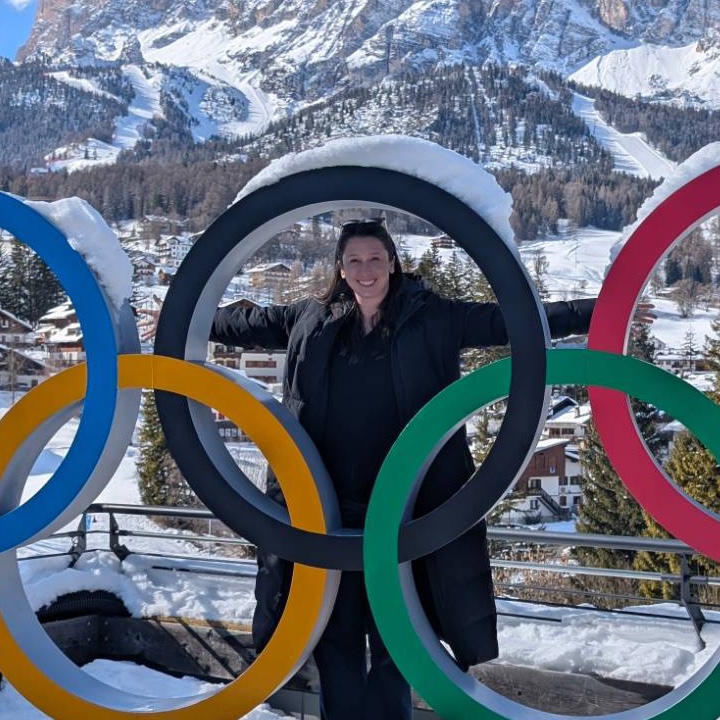
Portrait of Marissa Clark

Turning ambiguous questions into decisions people act on.

I'm a cognitive scientist turned data scientist. I build ML ranking models, prescriptive optimization, and causal analyses, then work across teams to turn the results into strategy.

01 — About

Brain → Business

I'm a Senior Data Scientist at United Airlines, where I work on MileagePlus loyalty, marketing, and partnerships. I build models that choose which members see which campaigns, which offers go to which customers, and how first- and third-party data fit together in clean rooms.

Before United, I led data science strategy at Kimberly-Clark, and before that I was a data scientist at Home Chef, working on TV attribution, customer lifetime value, and demand forecasting.

My path started in research. I studied the neuroscience of emotional experience as a PhD researcher at Dartmouth, after managing neuroimaging labs at Stanford and the University of Maryland. That background still shapes my work: careful experimental design, a healthy skepticism of easy answers, and a real interest in why people do what they do.

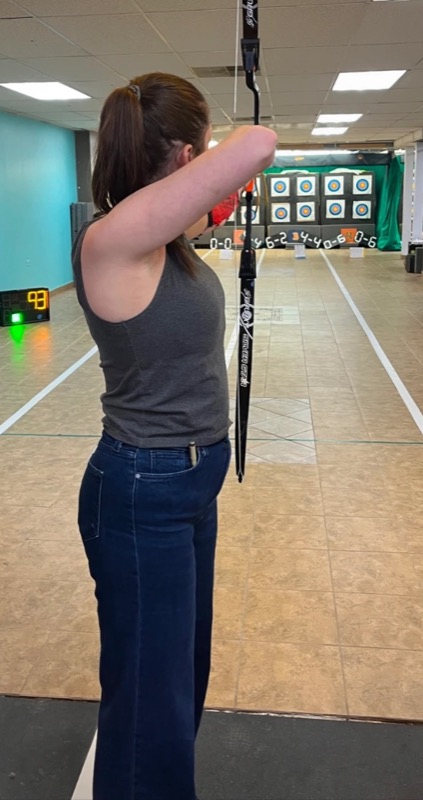
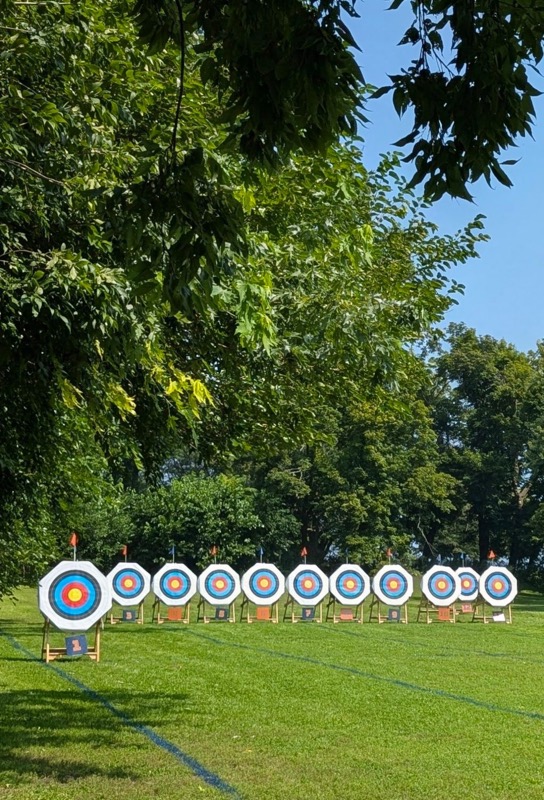
Outside of work I'm usually out with my dog, in the woodshop, or at the archery range. I track my scores with an app I built myself (see Projects).

02 — Experience

Where I've worked

  1. 2024 — Present

    Senior Data Scientist United Airlines

    I build the models behind MileagePlus marketing: who gets which campaign, which card offer goes to whom, and what partner data is worth. I also mentor junior data scientists.

    ML RankingOptimizationClean RoomsLoyaltyPartnerships
  2. 2023 — 2024

    Data Science Strategy Lead Kimberly-Clark

    I worked with marketing and commercial teams on consumer brands like Huggies. The work covered trade promotion optimization, third-party data evaluation, and teaching teams to use forecasting themselves.

    CPGTrade Promotion3P Data StrategyEnablement
  3. 2021 — 2022

    Data Scientist Home Chef

    At this meal-kit subscription business I measured what marketing actually drove and forecast demand, so less food went to waste. For TV attribution, I used Fourier analysis to separate daily and hourly ordering rhythms from the lift an ad actually caused, and those results shaped channel budgets. I also built a customer lifetime value model for budgeting and lifecycle marketing, meal-kit sales forecasting, and an NLP pipeline that sorted customer feedback so the team could spot new trends early.

    TV AttributionFourier AnalysisCustomer LTVForecastingNLPSnowflake
  4. 2018 — 2021

    PhD Researcher Dartmouth College

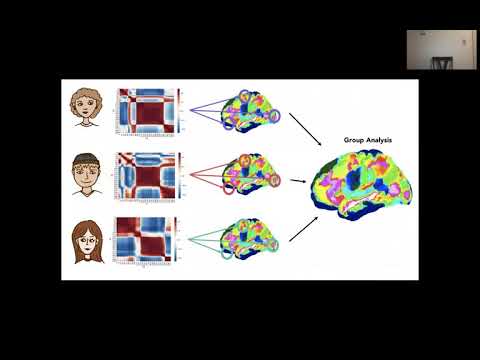
    In the Computational Social and Affective Neuroscience Lab (PI Luke Chang), I studied how the brain represents emotional experiences as they unfold in natural settings. My research used autobiographical videos to evoke a wide range of emotions and mapped how each person's feelings shifted, both in their own ratings and in their brains. I also managed the $3.5M grant that funded this research.

    fMRICollaborative FilteringShared Response ModelFactor AnalysisPython & R
    Watch · YouTube Research presentation: brain representations of unique emotional experiences
  5. 2016 — 2018

    Lab Manager Stanford University

    I ran day-to-day operations for the Stanford Social Neuroscience Lab (PI Jamil Zaki). I analyzed naturalistic emotion perception with an fMRI empathic accuracy task, which measures how well people track what someone else is feeling as they tell a real personal story. I also worked across the lab's empathy research and co-authored a school-based intervention study on motivating empathy in adolescents.

    Empathic AccuracyfMRI AnalysisStudy CoordinationField Experiments
  6. 2015 — 2016

    Lab Manager University of Maryland

    In the Neurocognitive Development Lab (PI Tracy Riggins), I led fMRI, EEG, and behavioral data collection for an NIH-funded longitudinal study of how memory networks develop in early childhood. I also trained the team on a new hippocampal segmentation tool and rolled it out, which made the lab's measurements of this small memory structure more accurate.

    Longitudinal DesignfMRI & EEGPediatric DataImage Segmentation
Dartmouth CollegePhD coursework, Psychological & Brain Sciences · 2018–2021
UCLABS Cognitive Science, minor in Neuroscience · 2015 · research in the Brain Mapping Center & Social Cognitive Neuroscience Lab
03 — Research

Publications & research

Journal of Experimental Psychology: General

A Brief Intervention to Motivate Empathy in Middle School

Weisz, E., Chen, P., Ong, D. C., Carlson, R. W., Clark, M. D., & Zaki, J.

In a study across four middle schools (n = 857), a norms-based intervention increased students' motivation to empathize. Higher motivation was linked to more prosocial behavior and to less loneliness and aggression.

Research · Dartmouth

Brain Representations of Unique Emotional Experiences

We used autobiographical videos to evoke a wide range of emotions and modeled each person's emotional path with collaborative filtering. On average, 7 dimensions explained 90% of the variance in ratings, more than the 2–5 found in earlier work. A shared response model found a common neural signal for changes in emotion in the default mode network.

04 — Projects

Things I've built for fun

Kotlin · Jetpack Compose · Wear OS

ArrowWatch ↗

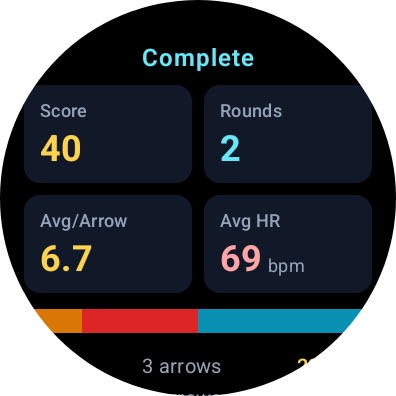
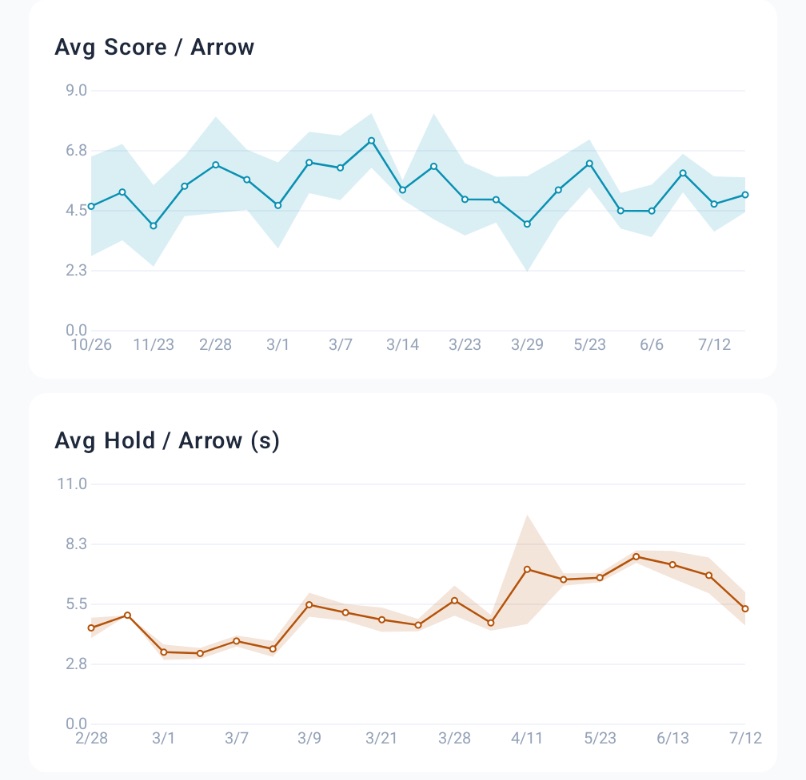
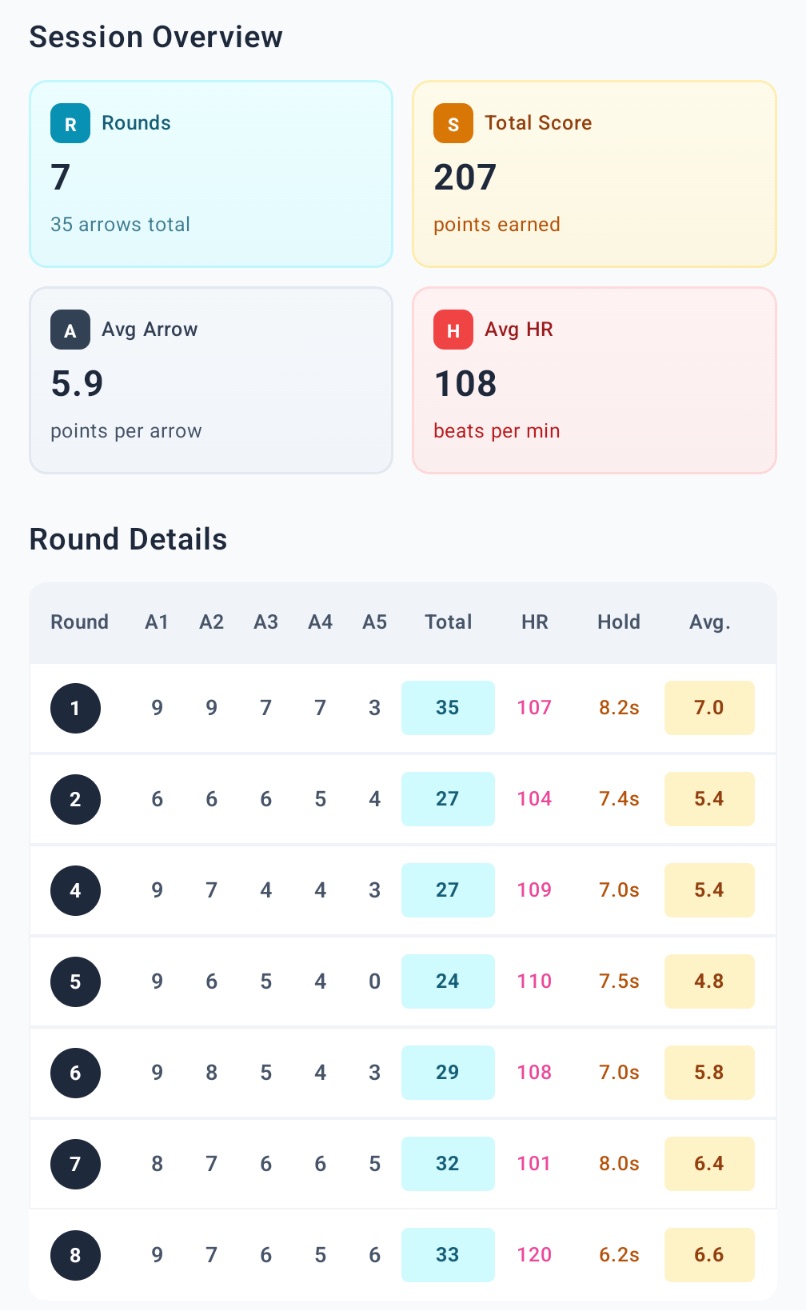
A Wear OS watch app and Android phone app I built to track my archery. I score arrows from my wrist at the range, and while I shoot, the watch records motion and heart rate. The phone app then finds each shot in the sensor data, so I can see how steady my draw was and how my heart rate moved alongside my scores.

AndroidWear OSSensor DataSignal ProcessingAnalytics
On the watch

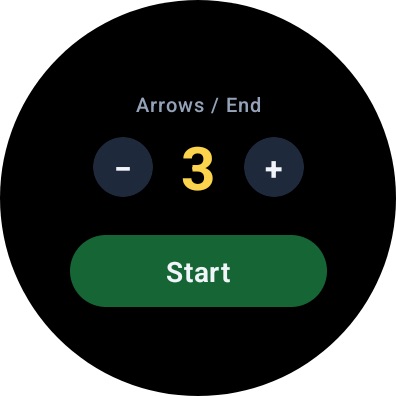
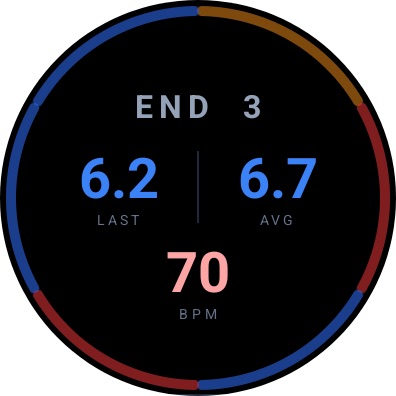
Start a session, choose arrows per round, and shoot. After each round, tap each arrow's ring color (gold, red, blue, black, white, or miss) or enter an exact total. The whole time, the watch logs orientation, gravity, steps, and heart rate. It streams each shot and score to the phone as they happen.
Finding shots in the sensor data

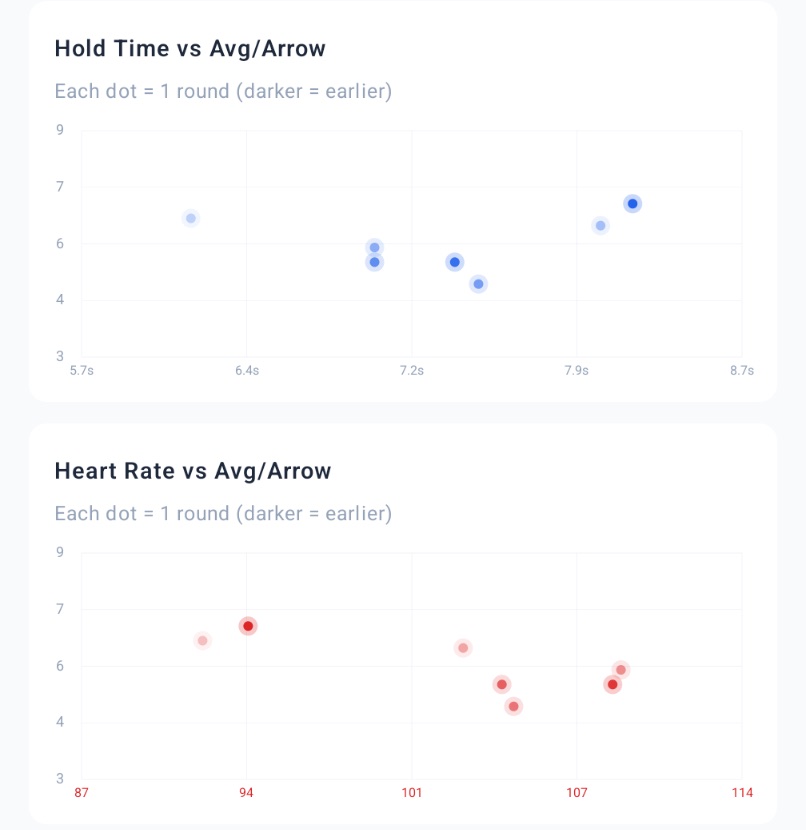
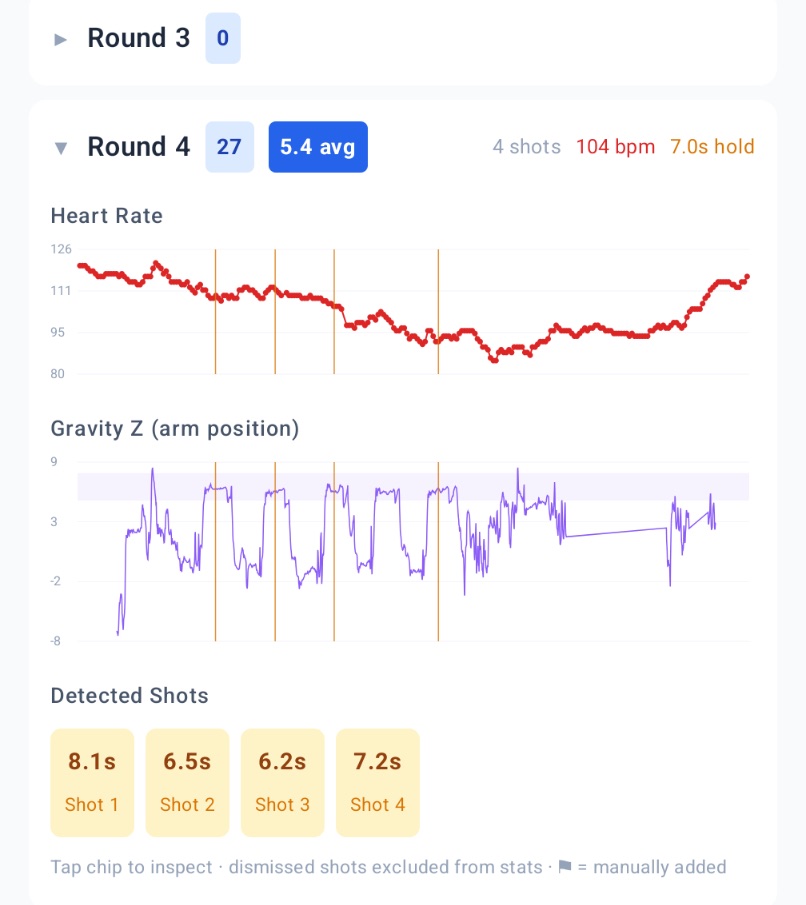
The analytics come from the raw sensor log. To find shots, the app removes slow drift from the arm-angle signal with a 60-second rolling median. Then it looks for stretches where the arm holds unusually still, which marks a draw-and-hold, and merges and filters those stretches into individual shots. Steps show when I walk downrange to pull arrows, and those walks split the session into rounds.
What the phone shows

A live scoring view during the session, then a history of every session with its ring-color breakdown and per-round scores. Each round opens into sensor charts: hold time, arm stability during the hold, and heart rate at each shot, plotted against my average score per arrow.
Why I built it

I wanted to know whether my good rounds and bad rounds looked different in ways I couldn't feel. It's the same loop I run at work (instrument, clean, model, and look for signal), just with arrows.
Python · NLTK · scikit-learn

Organizing Papers with Clustering ↗

Facing around 60 papers for my qualifying exams, I converted them to text and clustered them with TF-IDF, k-means, and Ward hierarchical clustering. That gave me study themes and showed how my committee's fields connected.

Open source

More on GitHub ↗

Neuroimaging tooling (NIMS→BIDS, nltools contributions), coursework, and other experiments from my research years to now.

05 — Toolkit

Tools I use

Languages

Python · SQL · R · Bash

Modeling

XGBoost · scikit-learn · Causal Inference · A/B Testing · Optimization (PuLP) · Forecasting · Multilevel Models · NLP

Platforms

AWS · SageMaker · Snowflake · Databricks · Airflow · dbt · Looker · Git

Data Strategy

Clean Rooms · Habu · LiveRamp · 1P/3P Data Evaluation · Data Partnerships

AI

Generative AI · LLMs · Prompt Engineering